The City of Lancaster is committed to making data-informed decisions and sharing metrics that detail the city government’s work. Below you will find key information highlighting the City of Lancaster’s initiatives as well as general information about Lancaster City.
Lancaster City Data Dashboard
Mapped Data
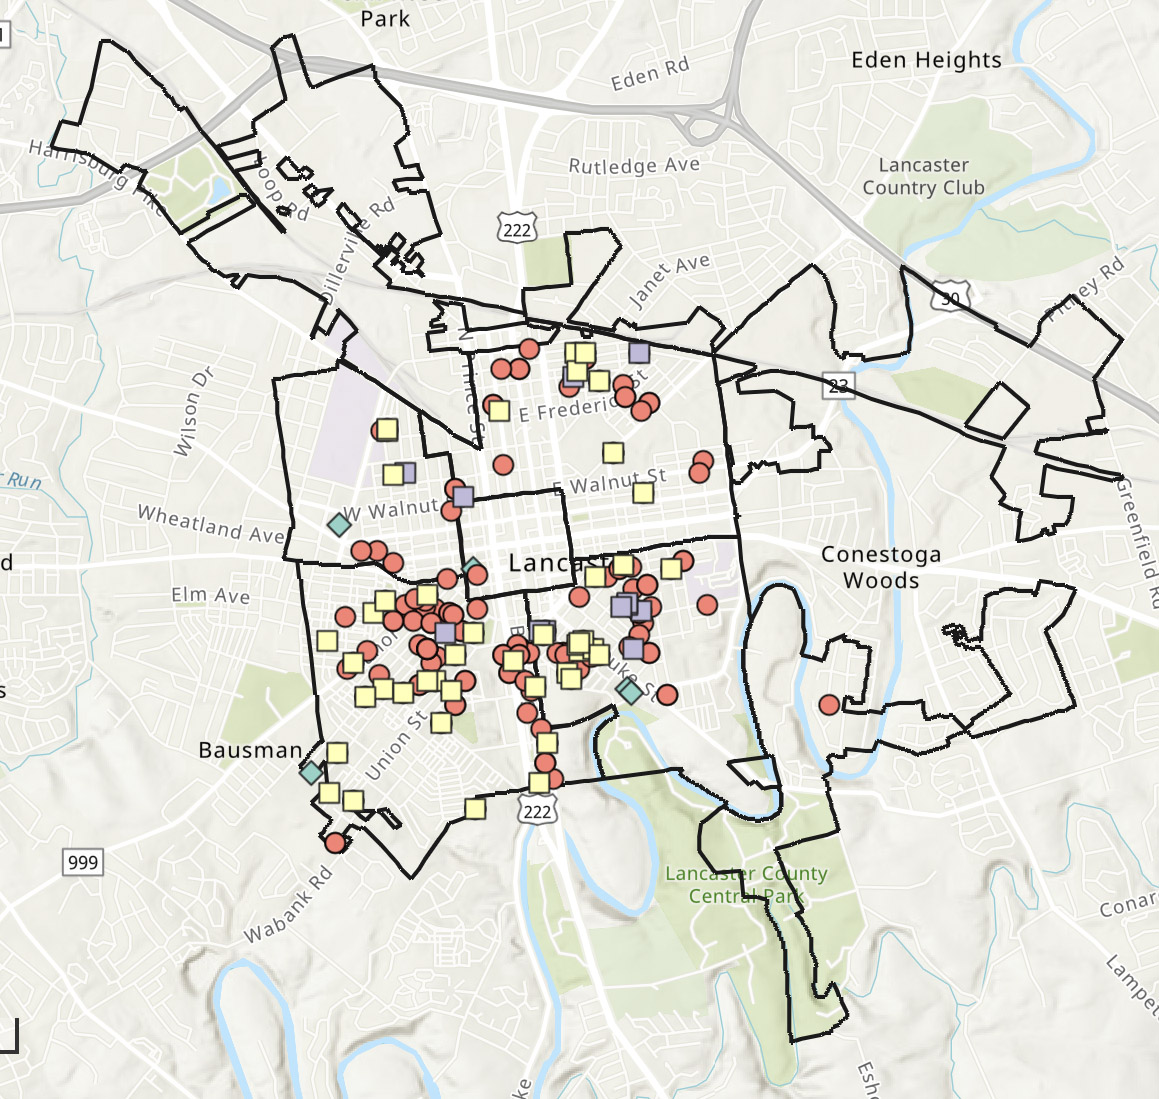
This map spotlights housing investments made by the City of Lancaster to support quality and affordable housing in our city. The map features the Critical Repair Program, the Lead Hazard Control Program, and HOME funds allocated toward home rehabilitation and new affordable housing.
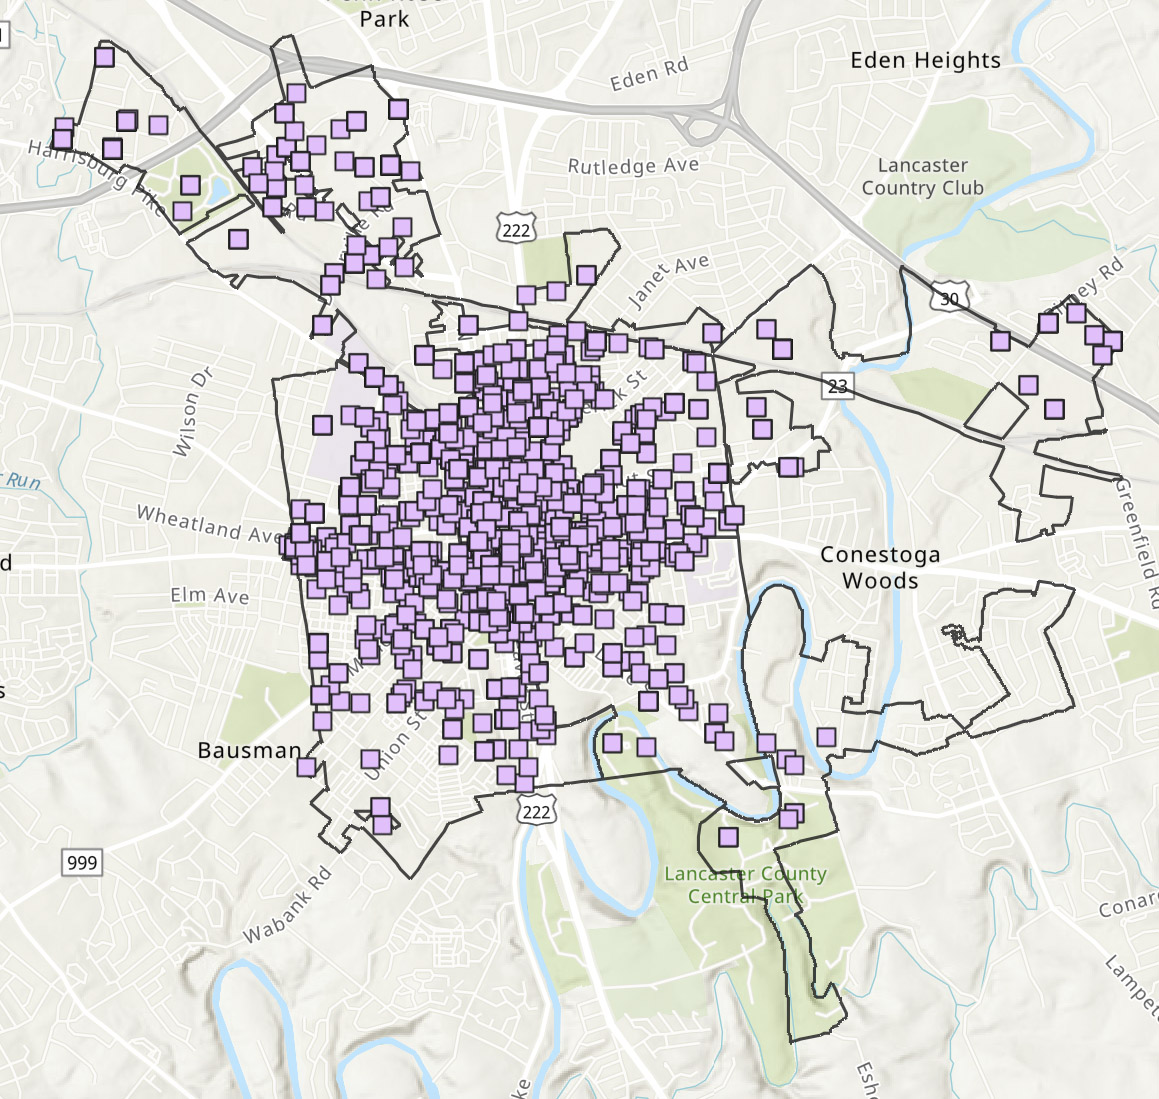
The City of Lancaster allocates public funds as one of its core duties, but the City also helps facilitate private investment into commercial and residential properties through issuing permits. Explore the map to see the distribution of private investments made into buildings in Lancaster City.
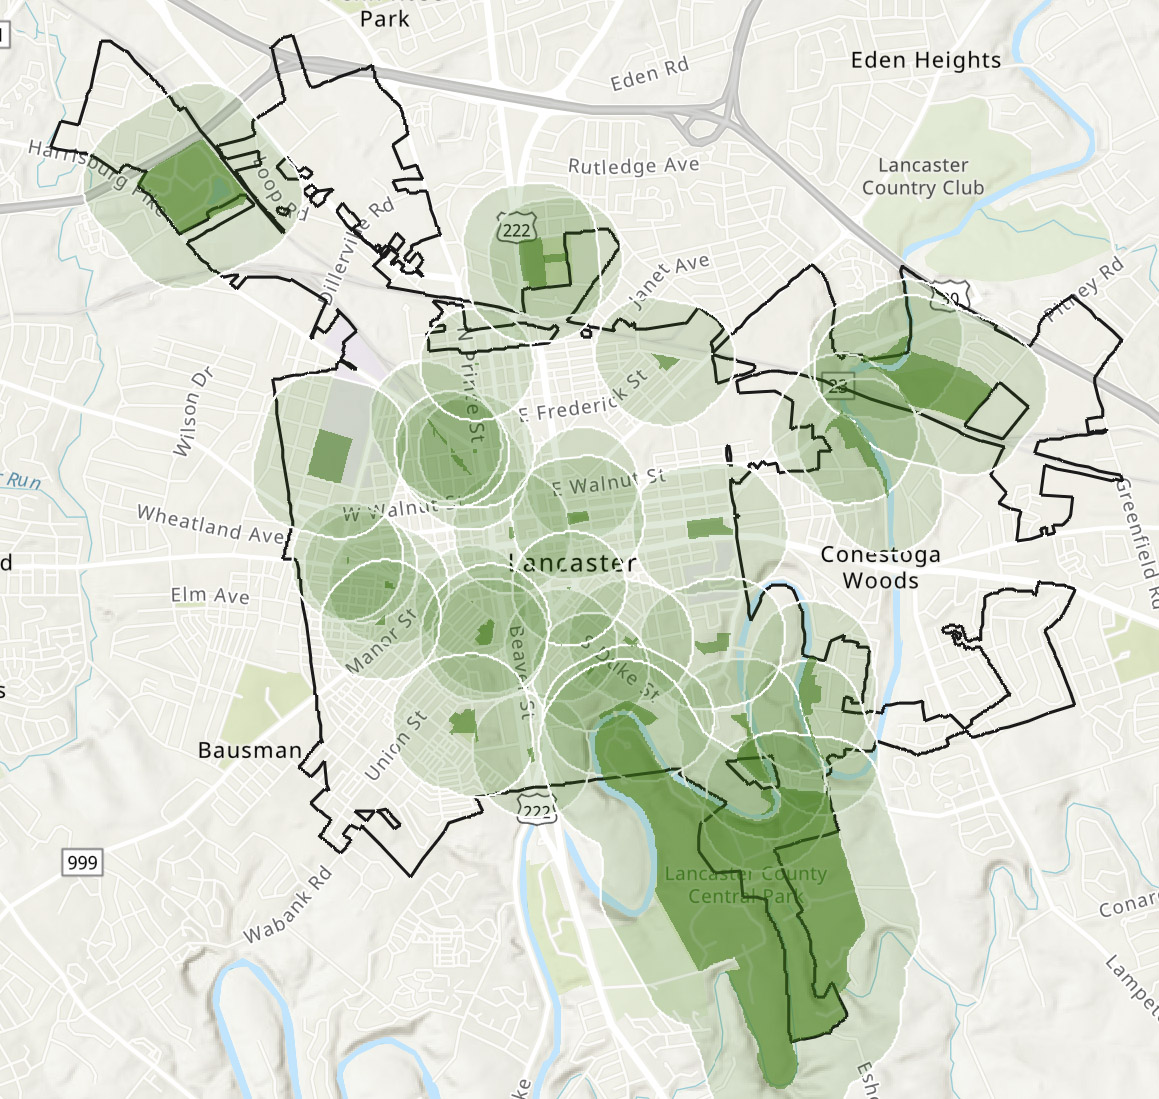
Accessible green spaces are important for people of all ages to have space to enjoy the outdoors, gather together, and exercise, especially during the COVID-19 pandemic. This map shows access to parks and other green spaces in the City of Lancaster within a 0.25 mile (or about 5-minute) walk.
Strong Neighborhoods
Housing
Safe Places
Sustainable Economy
(average wage difference between genders)
(spending 30% or more of gross income on housing)


